Trendlines are one of the most powerful tools in a forex trader’s toolbox. Simple yet effective, trendlines help traders identify the direction of the market, spot potential entry and exit points, and stay disciplined when analyzing price action. In this article, you’ll learn what trendlines are, how to draw them properly, and how to use them to enhance your trading decisions — all in a safe and beginner-friendly way.
What Are Trendlines in Forex Trading?
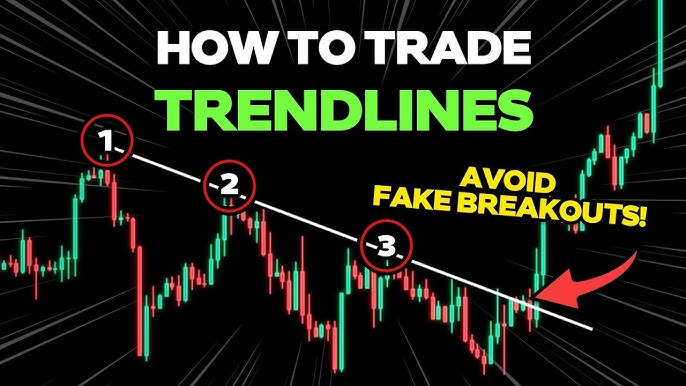
A trendline is a straight line that connects two or more price points on a chart and extends into the future to act as a guide for potential support or resistance. Traders use trendlines to identify uptrends, downtrends, and areas where the market may reverse or consolidate.
Trendlines help visually represent the momentum and direction of price, making it easier to follow market trends and avoid trading against them.
How to Draw a Trendline (Step-by-Step Guide)
Drawing a trendline is easy, but drawing a useful one takes some practice. Here’s a simple process:
1. For an Uptrend:
o Find two or more rising swing lows (price valleys).
o Connect them with a straight line.
o The more touches, the stronger the trendline.
2. For a Downtrend:
o Find two or more falling swing highs (price peaks).
o Draw a straight line connecting them.
o Again, more touches = stronger trendline.
Pro Tip: Use higher timeframes (like 1-hour, 4-hour, or daily) for more reliable trendlines.
Types of Trendlines
1. Uptrend Line:
A line drawn under higher lows in a rising market. Acts as support.
2. Downtrend Line:
A line drawn above lower highs in a falling market. Acts as resistance.
3. Horizontal or Flat Trendlines:
Sometimes trendlines form sideways — these are often used for range-bound markets.
Using Trendlines for Entries and Exits
Once you’ve drawn a trendline, you can use it in your trading plan:
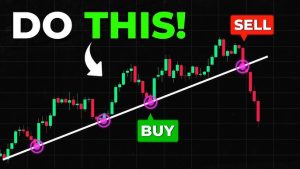
• Buy (long) near an uptrend line — when the price bounces off it.
• Sell (short) near a downtrend line — when price touches but fails to break it.
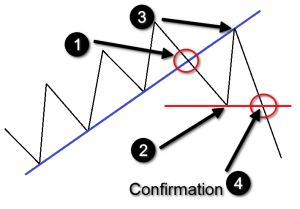
• Watch for breakouts — when price breaks through a trendline, it may signal a reversal or strong momentum shift.
Trendlines are best used with confirmation (like candlestick patterns or indicators).
Common Mistakes to Avoid

• Forcing trendlines to fit your idea — let the market speak.
• Using only two points — three or more makes it stronger.
• Ignoring timeframe context — what works on the 5-minute chart may not hold on the 1-hour.
• Using trendlines alone — combine with volume, RSI, or moving averages.
Tips for Beginners Using Trendlines
• Start on higher timeframes — less noise, clearer trends.
• Use demo trading to practice drawing and reacting to trendlines.
• Save charts with well-drawn trendlines to learn from your past work.
• Adjust your lines as price evolves — trendlines aren’t fixed forever
Conclusion
Trendlines offer a simple yet powerful way to understand market structure, stay disciplined, and identify trading opportunities. When used with care and confirmation, they can help you avoid emotional decisions and trade more confidently. Remember, trendlines aren’t magic — they’re a tool to guide your analysis, not predict the future.
Disclaimer
This article is for educational purposes only and does not constitute financial advice. Trading involves risk, and you should never invest more than you can afford to lose.