
Trading in financial markets—whether forex, stocks, or crypto—requires more than just intuition. Successful traders rely on market structure and technical analysis to identify opportunities, manage risk, and make informed decisions. This guide will help you understand the fundamentals of both, so you can build a solid foundation for your trading journey.
1. What Is Market Structure?
Market structure refers to how price moves over time, creating patterns that traders can study and interpret. It shows the “story” of supply and demand.
The three main market structures are:
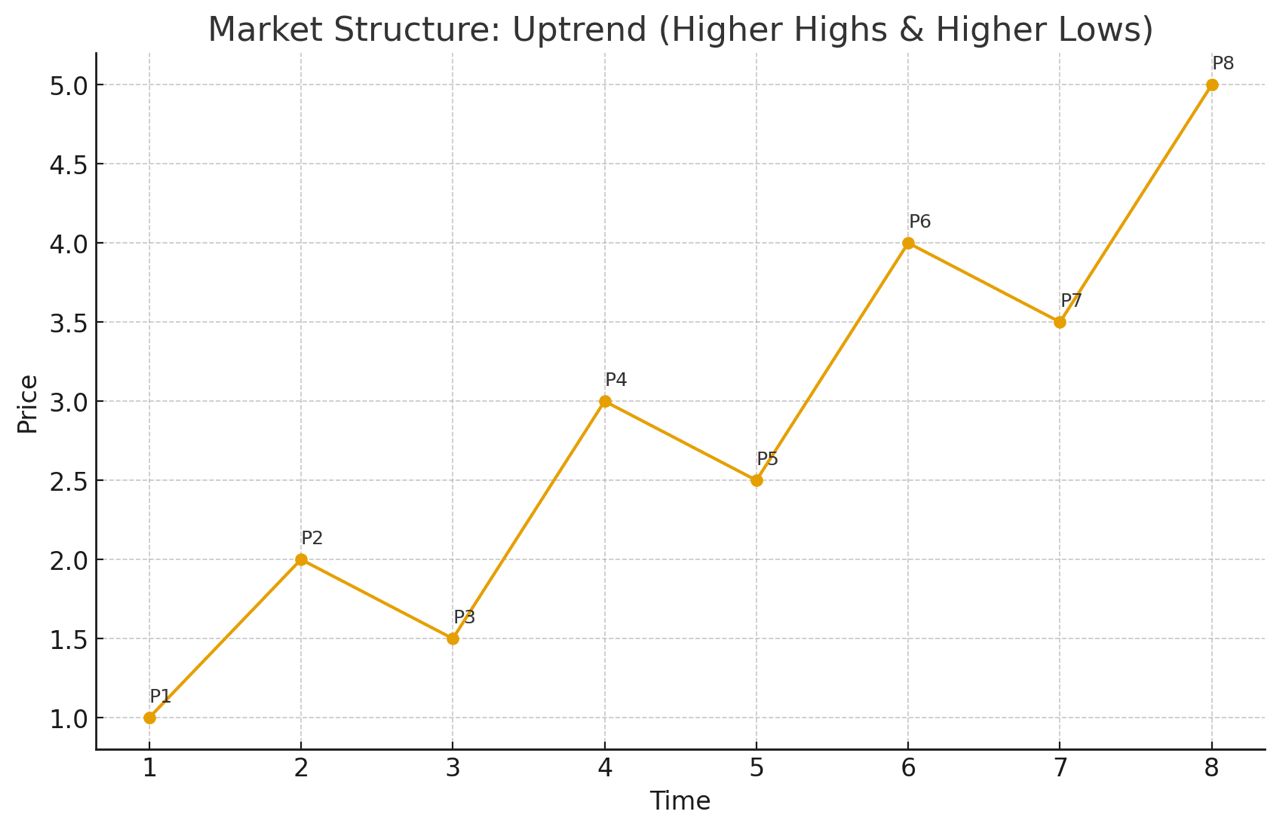
•Uptrend (Bullish Market): Price makes higher highs (HH) and higher lows (HL). This indicates buyers are in control.
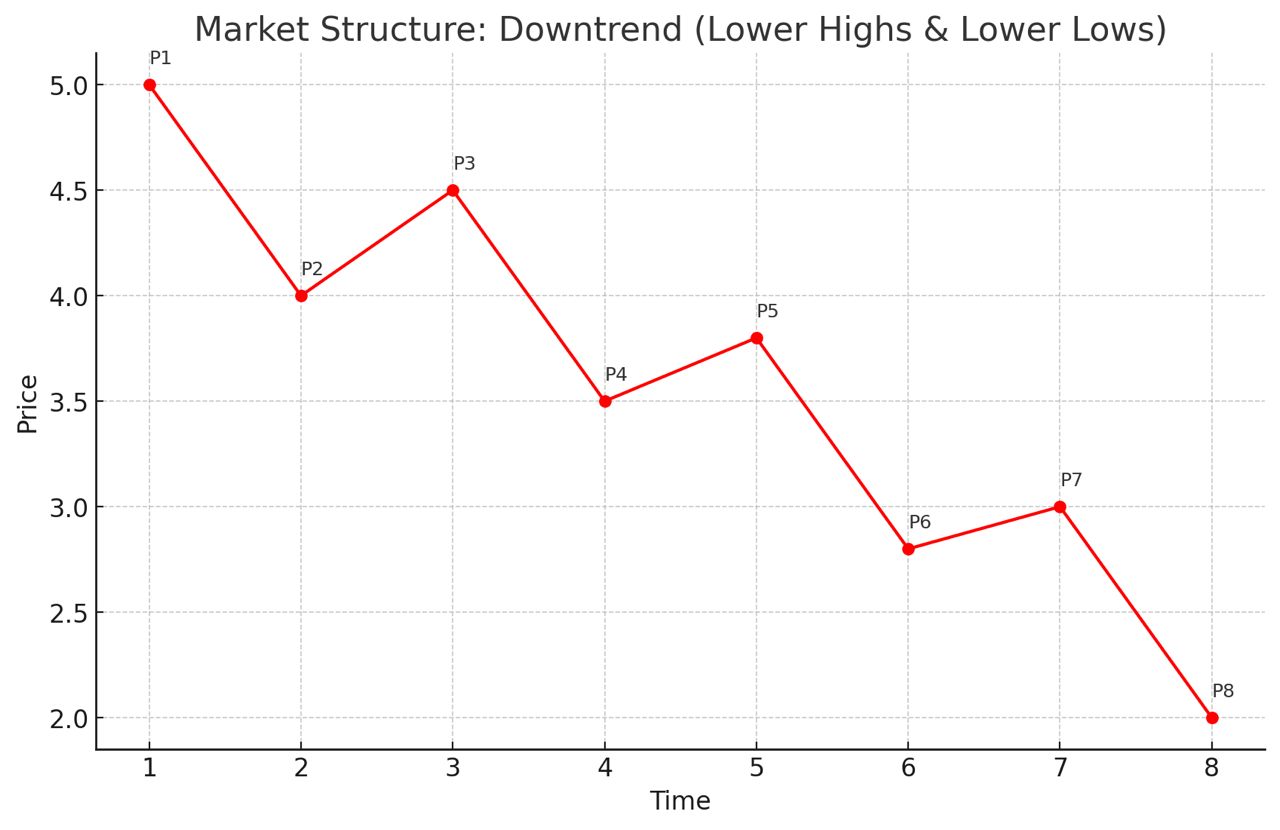
•Downtrend (Bearish Market): Price makes lower highs (LH) and lower lows (LL). This shows sellers dominate the market.
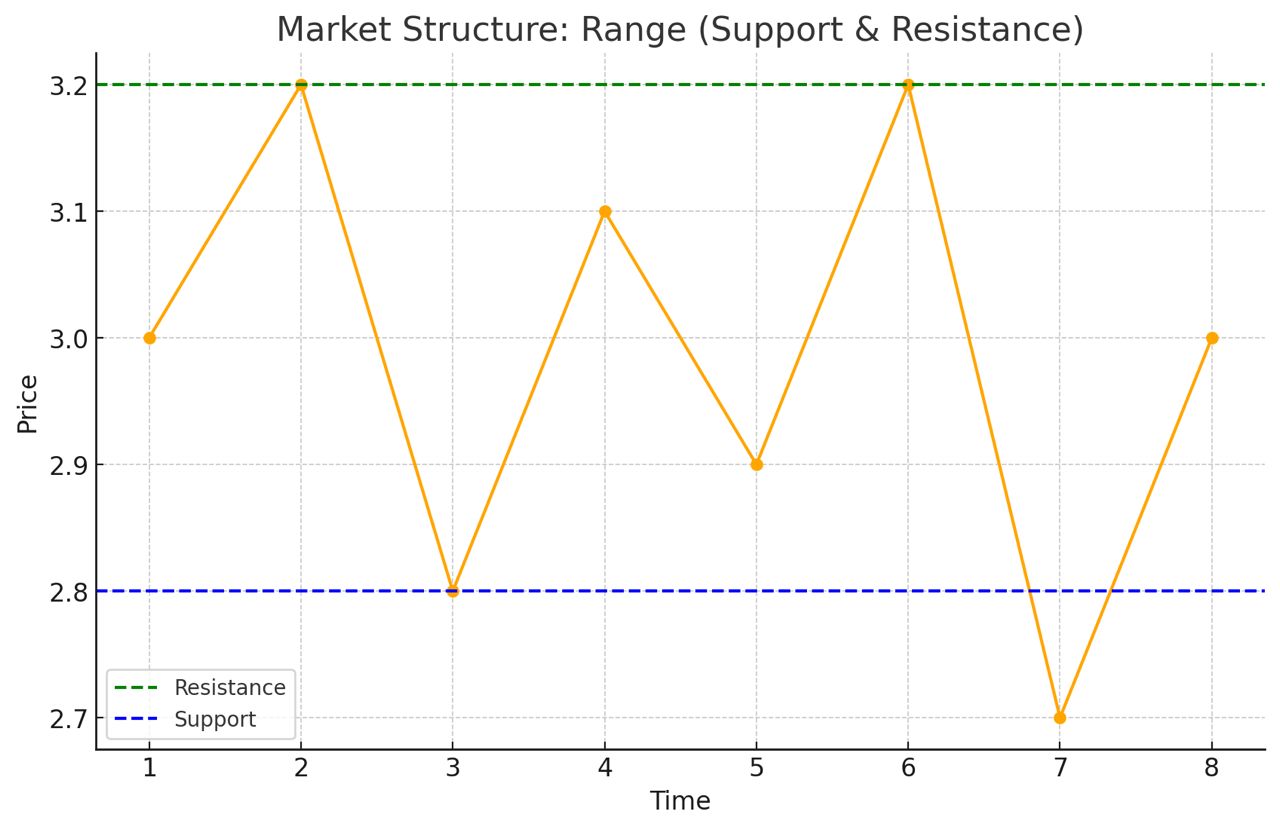
•Sideways/Range Market: Price moves between support and resistance without clear direction.
Understanding market structure helps traders know whether to look for buying opportunities, selling opportunities, or to stay patient.
2. Key Components of Market Structure
1.Support and Resistance
•Support = a price level where buyers tend to step in.
•Resistance = a price level where sellers tend to step in.
2.Break of Structure (BOS)
•When price breaks past a previous high or low, it signals a possible trend continuation.
3.Change of Character (CHoCH)
•When the market shifts from making higher highs to lower lows (or vice versa), it signals a potential trend reversal.
3. Introduction to Technical Analysis
While market structure shows the big picture, technical analysis (TA) provides tools to refine entries and exits. It involves studying price charts and indicators.
Some popular tools include:
•Trendlines: Drawn along highs or lows to highlight the direction of the trend.
•Moving Averages (MA): Show the average price over time, useful for spotting trend direction.
•Fibonacci Retracement: Helps identify potential pullback levels during trends.
•Candlestick Patterns: Provide clues about short-term momentum (e.g., engulfing candles, doji, pin bar).
4. Step-by-Step Guide to Using Market Structure + Technical Analysis
1.Identify the Trend
•Check if the market is trending up, down, or sideways.
2.Mark Key Levels
•Draw support and resistance zones on higher timeframes (e.g., daily, 4-hour).
3.Wait for Confirmation
•Look for candlestick patterns or a break of structure that confirms your bias.
4.Use Technical Tools
•Add Fibonacci levels, moving averages, or trendlines to refine entries.
5.Plan Entry and Exit
•Define where you will enter, where you will set a stop-loss, and where to take profits.
⸻
5. Example Scenario
Imagine EUR/USD is in an uptrend:
•Price makes higher highs and higher lows.
•You draw a trendline supporting the bullish move.
•Price retraces to a Fibonacci 61.8% level, forming a bullish engulfing candle near support.
This alignment (market structure + technical tool + candlestick confirmation) gives a potential long (buy) setup.
⸻
6. Risk Management (Never Ignore This!)
Even with perfect analysis, no trade is guaranteed. That’s why professional traders always manage risk:
•Use stop-loss orders to limit losses.
•Risk only 1–2% of your account per trade.
•Stick to your plan and avoid emotional trading.
Final Thoughts
Understanding market structure and applying technical analysis is like learning the language of the market. With practice, you’ll recognize patterns, refine your strategies, and trade with more confidence. Always remember: patience and discipline matter as much as knowledge.
Disclaimer: This article is for educational purposes only and does not provide financial advice. Trading involves risk, and you should never trade money you cannot afford to lose.