In the world of forex trading, mastering technical analysis is key to making informed decisions. One of the most fundamental concepts in this area is understanding support and resistance. Whether you’re new to trading or brushing up on the basics, this guide will walk you through what these terms mean, why they matter, and how to identify them in your trading journey.
What Is Support in Trading?

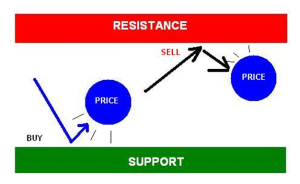
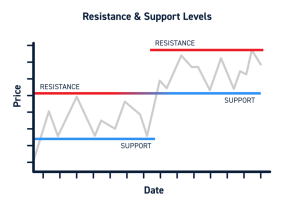
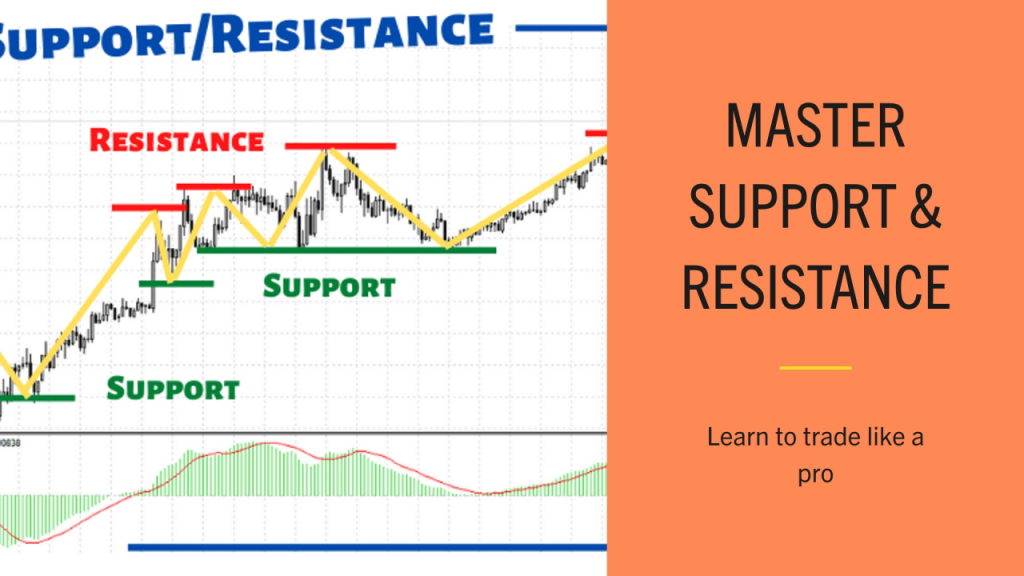
Support refers to a price level where a currency pair tends to stop falling and may even bounce back up. It’s like a “floor” where buyers typically step in, preventing the price from dropping further.
For example, if EUR/USD drops to 1.0800 several times but always rises afterward, that level may act as support. Traders often use support zones to identify potential buying opportunities — not as a guarantee, but as an area of interest.
What Is Resistance in Trading?
Resistance is the opposite. It acts like a “ceiling” where a price often struggles to rise above. When a currency pair hits a certain level and repeatedly fails to break through, that zone is seen as resistance.
Say GBP/USD climbs to 1.2700 multiple times but never breaks higher — that level becomes a resistance zone. Traders might use this level to consider potential selling areas or to tighten stop-losses if they are already in a long position.
Why Support and Resistance Matter

Support and resistance zones help traders:
• Spot potential entry or exit levels
• Set stop-loss and take-profit targets
• Identify trend continuation or reversals
• Make more disciplined and strategic decisions
They don’t predict the future, but they help frame the possibilities.
How to Identify Support and Resistance
There’s no single method — most traders use a combination of the following:
• Historical Price Levels: Look at past highs and lows on your chart.
• Psychological Round Numbers: Many traders watch levels like 1.3000 or 1.0000.
• Trendlines: Diagonal support/resistance along trend directions.
• Moving Averages: Popular indicators like the 50 or 200 EMA can act as dynamic support or resistance.
• Fibonacci Retracement Levels: Useful for finding support/resistance within a trend.
Tips for Beginners
1. Use confirmation — Don’t buy/sell just because a level exists; look for patterns or volume confirmation.
2. Avoid over-complicating — Focus on clean, obvious levels to reduce confusion.
3. Combine with other tools — Indicators, trendlines, and candlestick patterns can add context.
4. Always use risk management — Support and resistance can break, so use stop-loss orders.
5. Practice on demo accounts — Test your skills before using real money.
Conclusion
Support and resistance are core ideas in technical analysis. When understood and used correctly, they help traders make more thoughtful decisions.Remember, they are tools — not guarantees. Markets are influenced by many factors, and no method is perfect.
Disclaimer
This article is for educational purposes only and does not constitute financial advice. Trading involves risk, and you should never invest more than you can afford to lose.


